- AuthorPosts
- April 20, 2019 at 13:47 #28202
Juanjo
ParticipantHi,
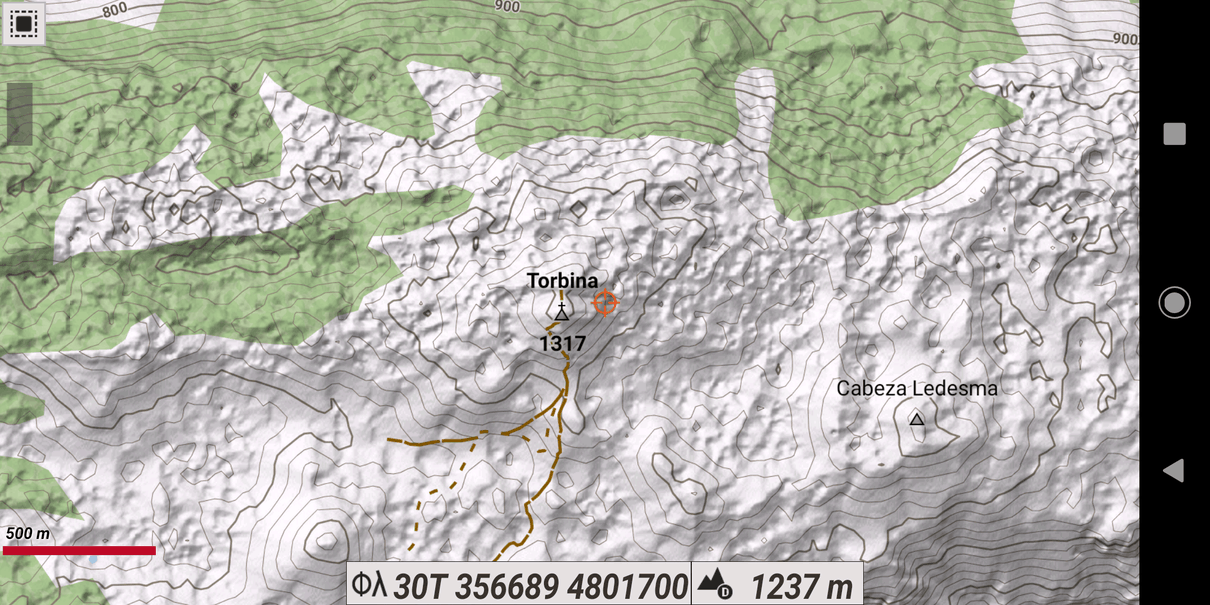
I am trying to improve Sierra del Cuera sector in OSM. This is a karstic massif in the North of Spain and therefore it is plagued of depressions/sinks.
OpenAndroMaps renders depressions contour lines the same way as normal ones with the consequence that one can think there is a hill where in reality there is a depression.
Would it be possible to somehow tag depression contours as such and distinguish them on the map from other contour lines by hachures marked on the downslope?
RegardsApril 22, 2019 at 19:22 #28217 ChristianKKeymaster
Would it be possible to somehow tag depression contours as such and distinguish them on the map from other contour lines by hachures marked on the downslope?
Hi,
Unfortunately this is not possible.
These Contourlines are simple ways in the maps.BUT:
If you enable hillshading in Locus/Orux you see the depression – this is calculated in both Apps by downloaded SRTM/HGT – files.Best regards
ChristianApril 22, 2019 at 20:00 #28219ParticipantBUT:
If you enable hillshading in Locus/Orux you see the depression – this is calculated in both Apps by downloaded SRTM/HGT – files.Hi Christian,
this is what I do, I do use SRTM data provided by Sonny, but still, at this resolution (+- 30m) is not obvious to see the depressions let alone the sinks.
Just to give you an idea of the complexity of the terrain, I attach a screenshot where hillshading is done using a 5m DEM.
I don’t know which tool do you use to generate the contour lines … but gdal_contour documentation states ‘Starting from version 1.7 the contour line-strings will be oriented consistently. The high side will be on the right, i.e. a line string goes clockwise around a top.’, which makes me think that it will go counter clockwise around a depression.
If you happen to use GDAL, this may be a starting point.
Regards
- AuthorPosts
- You must be logged in to reply to this topic.