Winter 2023/24: Update of OAM base maps and settlements; emphasize country borders (Rel. 202401-1.0)
 [Full resolution overview page]
 ![[Full resolution overview page]](https://www.openandromaps.org/wp-content/users/michael/World-zooms-OAM-12-EN.jpg)
Please note that these maps are NO vector maps, as those cause massive performance issues at low zoom levels. The overview maps as raster maps are way faster here; vector maps have their unique strengths for high level of detail in higher zoom levels. The world maps are in MBTiles format, which can be used by all major geo apps (some maps are offered as SQLiteDB, too, because OSMand does not handle MBtiles). And there are even apps for iOS that can handle the MBtiles format.
As usual for OAM, buttons for fast install in Orux and Locus are provided. Both apps are able to handle world maps, using very different mechanisms, however. (See the help files provided by the respective apps.)
What differentiates those maps from usual OSM renderings, and why? The potentially random display of labels (e.g. for settlements) is a real annoyance in the rendering tools available. Hence I took explicit control (with quite some scripting) of the selected objects in the generation process of the world maps.
Currently, this information is being processed in the following way:
- The capitals of countries, states and provinces of many countries are shown in 3 different colours, in English and the local language (if significantly different).
- The size of the settlement labels increases by population, if provided in the OSM data set (hopefully correctly!), otherwise a minimum assumption is made for the categories city, town and village. The population size categories are available in Christian's OAM maps as "popcat" tags. They can be used by themes to appropriately render and also to select (restrict) the settlement names to be displayed. Tobias' Elevate theme is using those tags for rendering.
- Islands and archipelagos, in particular the remote ones, are hard to spot on maps. To remedy this, they are highlighted, from zoom level 3 and up.
- Triggered by an OAM forum discussion about visibility of peaks important peaks are now highlighted (see for ZL dependencies). This has been implemented with the help of Max' algorithm.
- Also the major ocean deeps are shown.
- In addition different types of power generation stations and energy sources are displayed as wind turbines in particular make excellent land/seamarks.
The intent behind all that is to have the essential map information available at your finger tip, fully OFFLINE. A sort of companion for Wikipedia, which is available offline as well, by Kiwix and Aard2, which I highly recommend.
However, for those who are not interested in this additional level of details, I also created a version (with "min" added to the map name) that shows only the background maps up to zoom level 7, and above only the settlement and capital names on top of the OAM background.
Release notes 202401-1.0
- The OAM background from ZL 8 and up now is rendered from the December 2023 edition of Christian's OAM vector maps (except Near East, for which the OSM vandalism repair is still ongoing - status there is Sept. 2023).
- In ZL 5 to 7 country borders are shown in red, while regions (in Russia), states (in US) and provinces (in Brazil and Canada) are rendered in violett.
- Settlement rendering was updated from 2021 state uo current, after a number of corrections and cleanups. If you spot something that went wrong, pls. let me know.
| Which map categories do I need from below? Following the main purpose of all those maps it's about covering the lower zoom levels with a meaningful map, where all vector maps miserably fail. - Hence please choose one of the OAM-World-1-... maps (ZL 8-11). You will notice the tradeoff between maximum zoom level included and map file size. - Beyond ZL 11 complete world maps would blow even most recent devices. This is why regional maps are the only way for ZL 12/13. - But why there are separate maps for ZL 11? Well, people may want to have the world up to ZL 8, 9 or 10 only. Then the OAM-W1-7/8- The following map types are provided: - world maps ZL 8 to 11 in JPG 80% quality as MBTiles - world maps ZL 10 and 11 in PNG format as sqlitedb (for apps that cannot handle MBTiles) - regional maps up to ZL 11 (all continents), 12 (large parts of Africa, Asia, Europe and North America) and 13 (differently sized segments of Europe and of North America like for ZL 12) in JPG 80% resp. 70% qualities as MBTiles. There are two ways to download them: - app specific download automation for Locus and Orux for the MBTiles world maps only - all (other) maps can be downloaded as file to a smartphone directly or via a PC. (This is required for the MBtiles world maps, too, if people want to put maps into non-standard locations in the file system.) |
| App / Map Category | Installation / Download, size of (compressed /) extracted map |
|---|---|
| Installation of the map in Orux right on your device | |
| Installation of the map in Locus right on your device | |
| Manual installation, unzip if needed, move map file to a folder which can be handled by the resp. app. | |
| In addition to the MBTiles format the ZL 10 and 11 world maps are offered as SQLiteDB, as there are apps that cannot handle MBTiles. For ZL 10 a JPG-80 version is provided; while the tiles of the other 2 maps are coded as loss free PNG images, which implies large file sizes. This format makes sense e.g. for exports and screenshots on high resolution devices, regardless of app aspect. | |
| Regional maps provide more details for the respective region, while giving a world overview only on a lower zoom level: there are ZL 11 maps for all continents, ZL 12 for a number of regions and ZL 13 for some. They can be used in addition to a World map, if the app allows overlays, or as an independent map instead. | ZL 11ZL 12ZL 13 |
Before you start one of the torrents, make sure you ONLY select in your Torrent App those maps that you want, from the embedded folders WorldMaps202401, RegionZL11Maps202401 or RegionZL12-13Maps202401 (a total of nearly 30 maps with about 120 GB)!
Coverage of maps
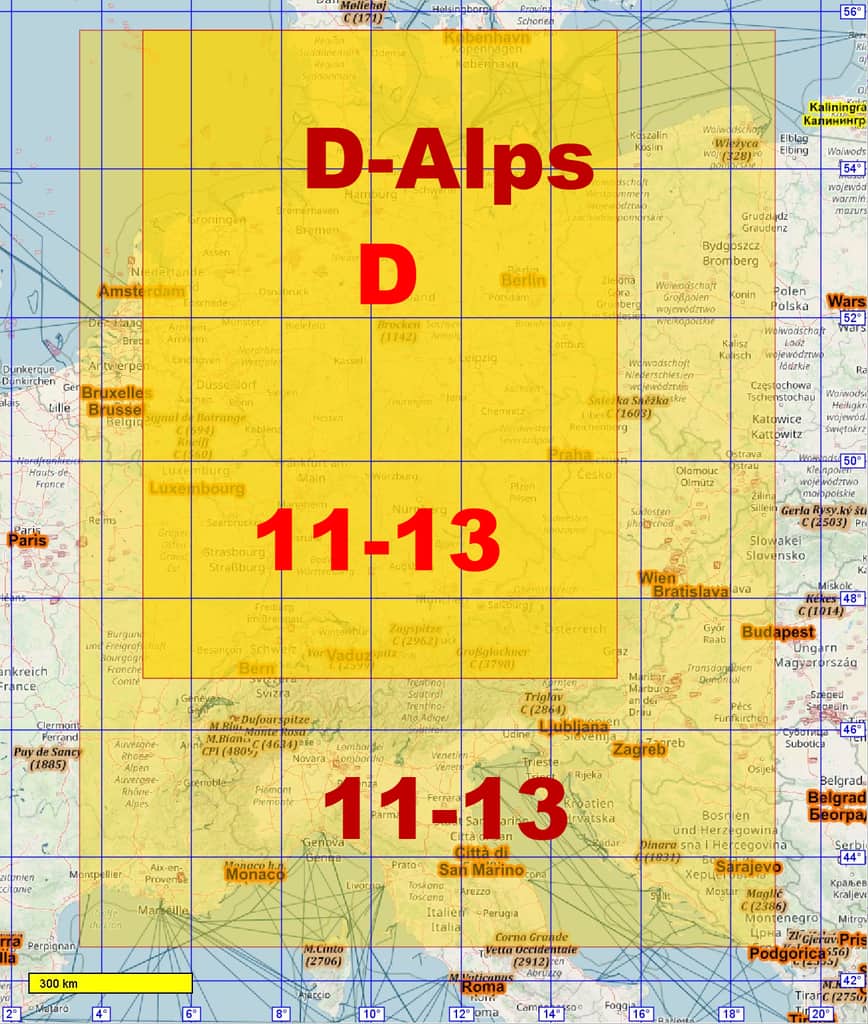
World ZL 1-9 World ZL 10 World ZL 11 AF ZL 12 AS ZL 12 EP&MENA ZL 11-13 EP 12-13 D&Alps ZL 11-13
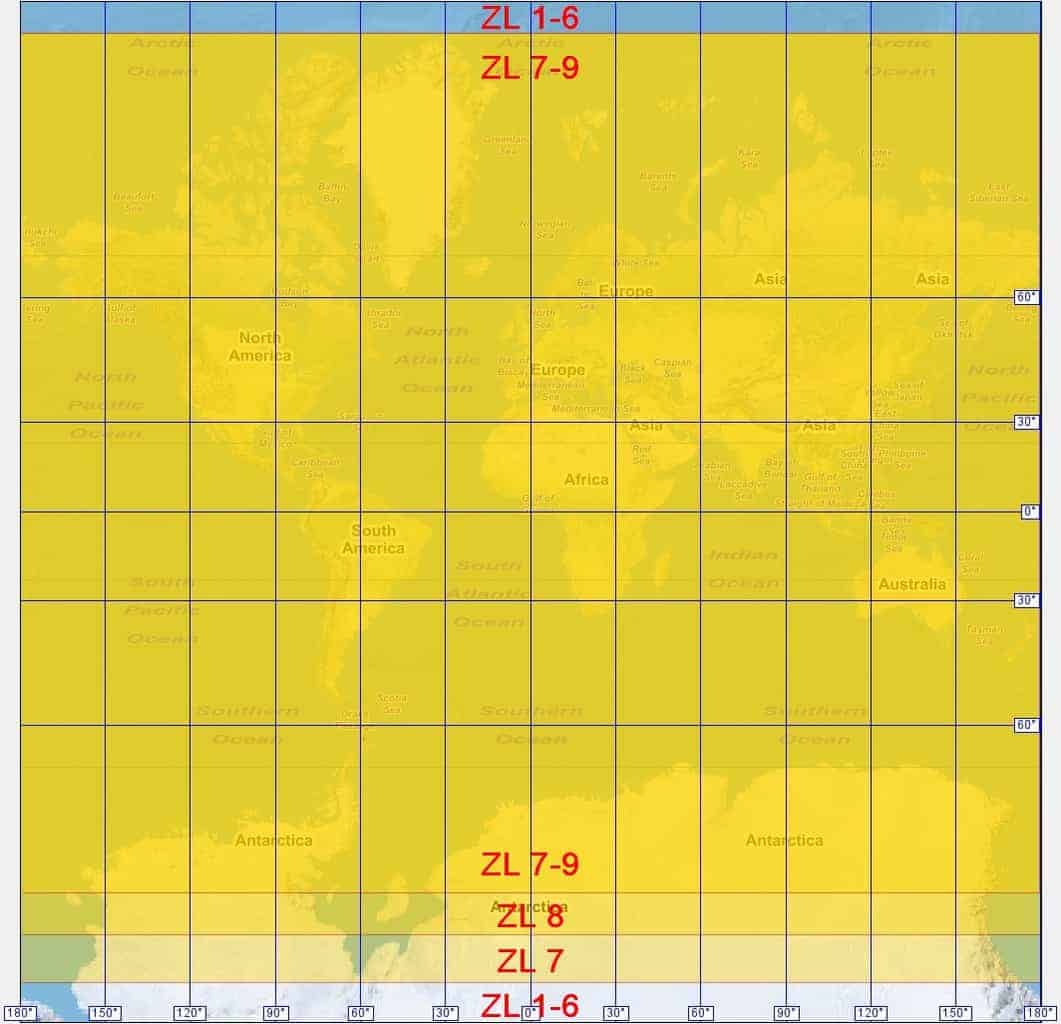
- ZL1: background from www.giss.nasa.gov/tools/gprojector/help/projections/GallIsographic.png (using Gall-Peters projection), with major oceans added in English. Lon/Lat degrees amended to grid, as app coordinates (Lat) will mislead with this projection!
Range +/- 85 degree; with continents and major oceans named in English. - ZL2: background map: "Made with Natural Earth" (naturalearthdata.com) + korona.geog.uni-heidelberg.de/tiles/asterh (hill shading)
Range +/- 85 degree; major golfs, bays and seas are named in addition. - ZL3 background map: Made with Natural Earth (naturalearthdata.com) + korona.geog.uni-heidelberg.de/tiles/asterh (hill shading)
Range +/-85 degree, in addition all countries names, and some major cities (yet only a few capitals). Different vegetation colouring, no sea depth indication. Most country borders are visible. Remote islands are added in italic with light greenish background and ant-/arctic stations have a light yellow halo. The most relevant peaks in Antarctica are displayed with brownish background, the deepest points in the ocean trenches in blue letters. - ZL4: background map: tile.opentopomap.org
Range +/-85 degree, topographic colouring of elevation; borders are shown; all country names are displayed with white border. The world's most isolated peaks (isolation > 1000 km) are shown now. - ZL5: background map: korona.geog.uni-heidelberg.de/tiles/roads + korona.geog.uni-heidelberg.de/tiles/asterh (hill shading (*))
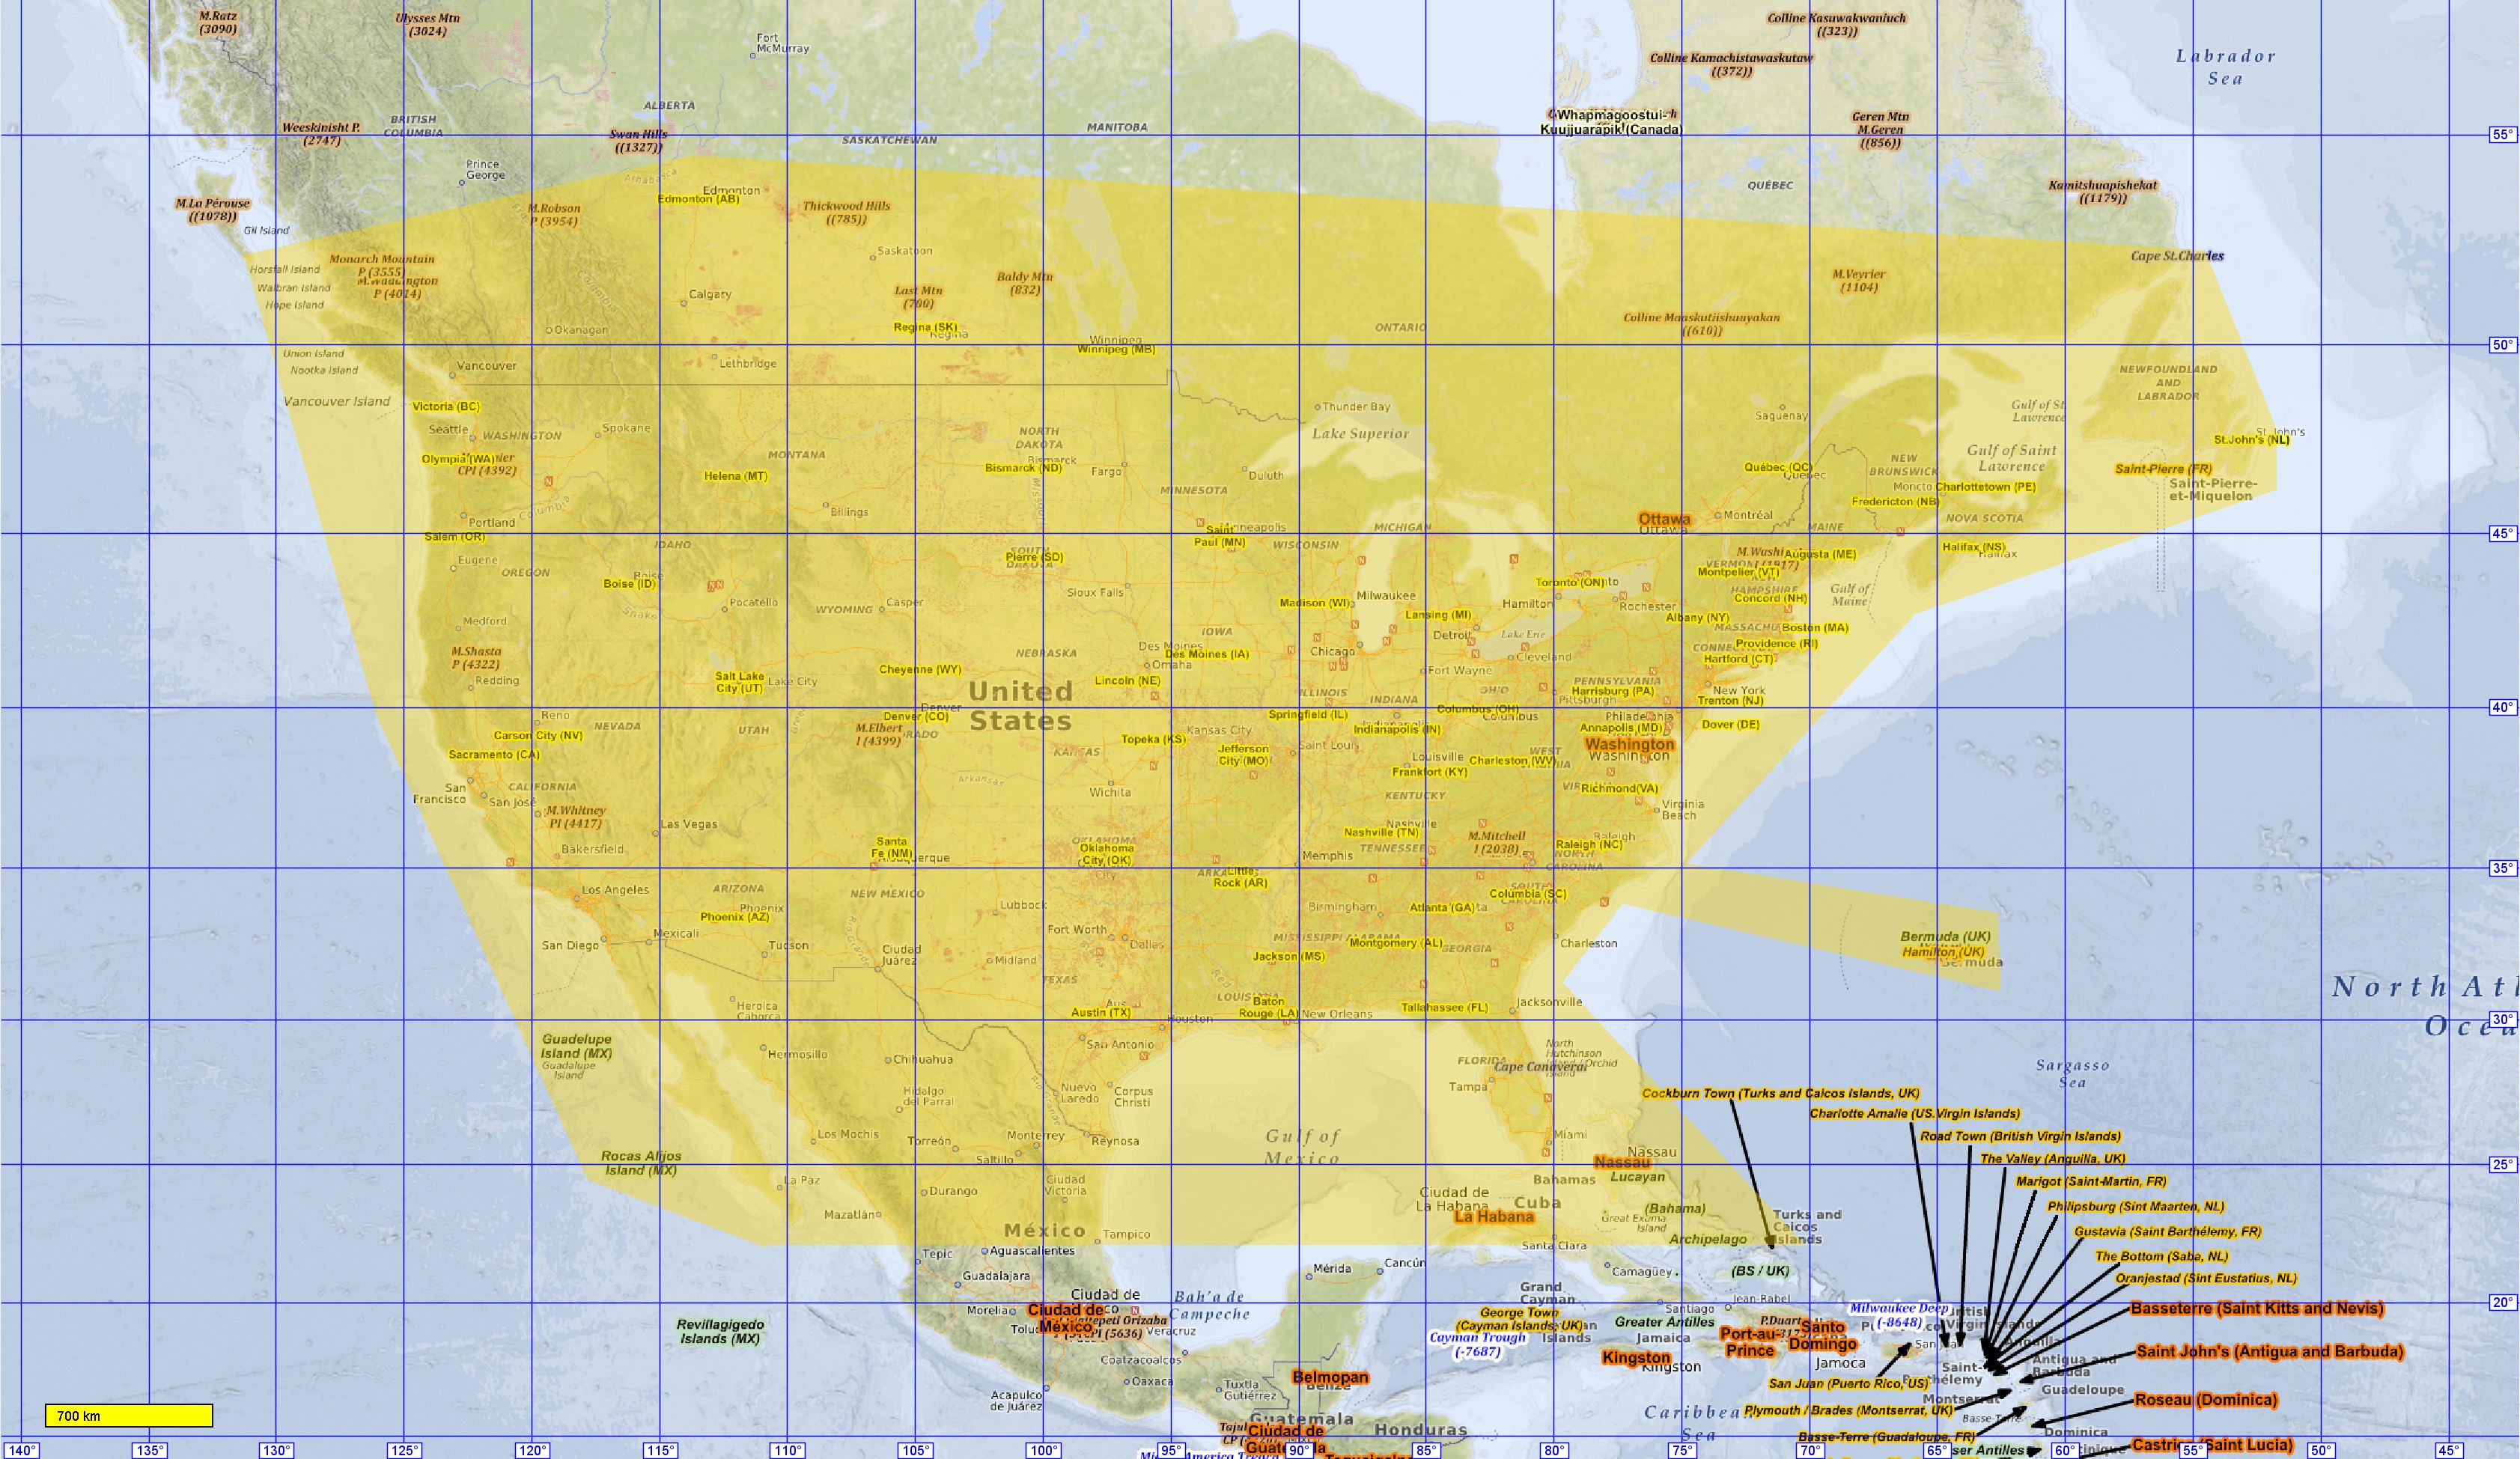
Range +/-85 degree, vegetation colouring, sea depths are colour coded. Many base map names in local language (only). All country capitals and those of regions/states of larger countries are highlighted by halos: red for countries, orange for dependencies and regions resp. yellow for provinces, in English and local language (as available). Major highways are visible.
The 125 most prominent peaks of the world (list from Wikipedia) are shown in addition. - ZL6: background map: tile.openstreetmap.de/tiles/osmde + korona.geog.uni-heidelberg.de/tiles/asterh (hill shading (*))
Range +/-85 degree, province capitals of some large countries appear. On the backgound map which shows the administrative structures, major cities and major secondary roads become visible.
The high points of all countries are included, too. - ZL7: background map: korona.geog.uni-heidelberg.de/tiles/roads + korona.geog.uni-heidelberg.de/tiles/asterh (hill shading (*))
Range 84N/83.5S, vegetation colouring similar to L5, sea depths are colour coded. Many settlements names are shown in local language. For countries with a reasonable "density" of provinces, their capitals are highlighted. - (*): the hill shade layer for the high North has been revreated based on new elevation data (viewfinderpanoramas.org).
- ZL8/9/10+: background map: vector maps from www.openandromaps.org with adapted Elevate theme, omitting settlement names, though.
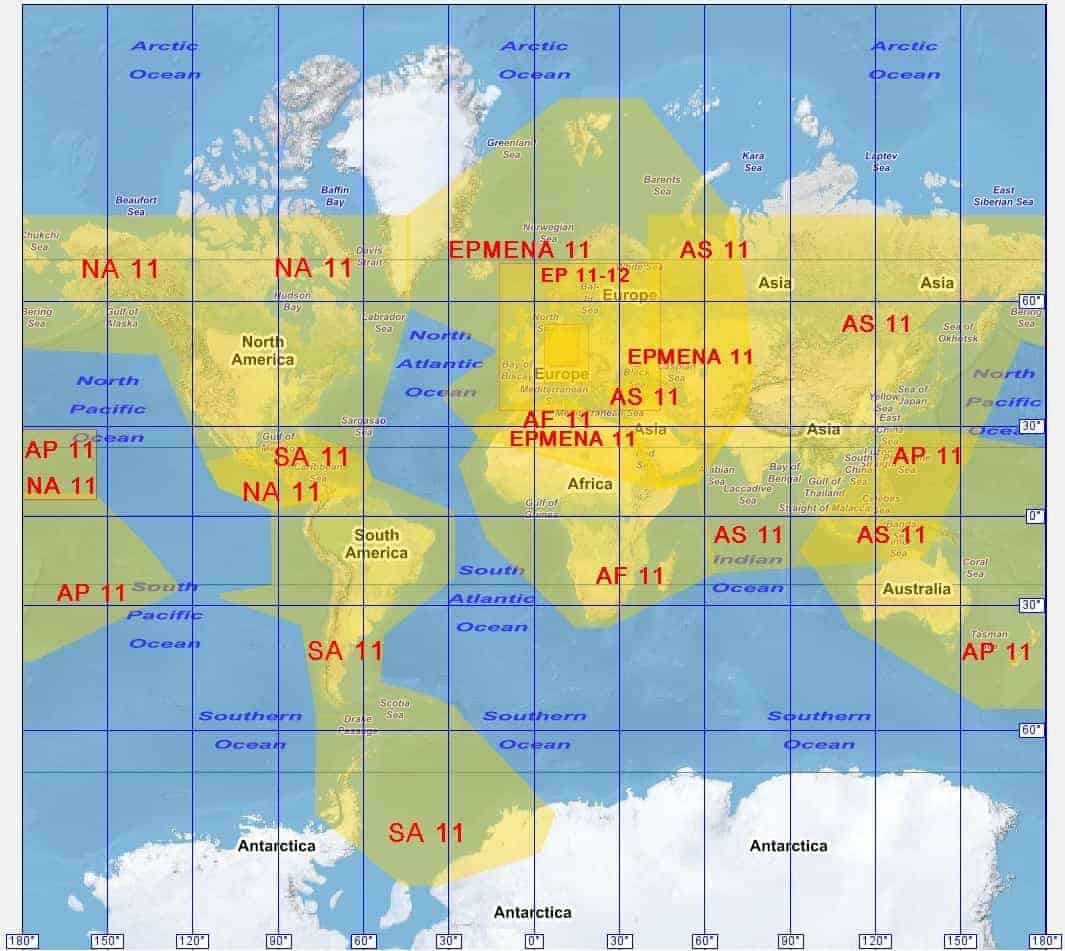
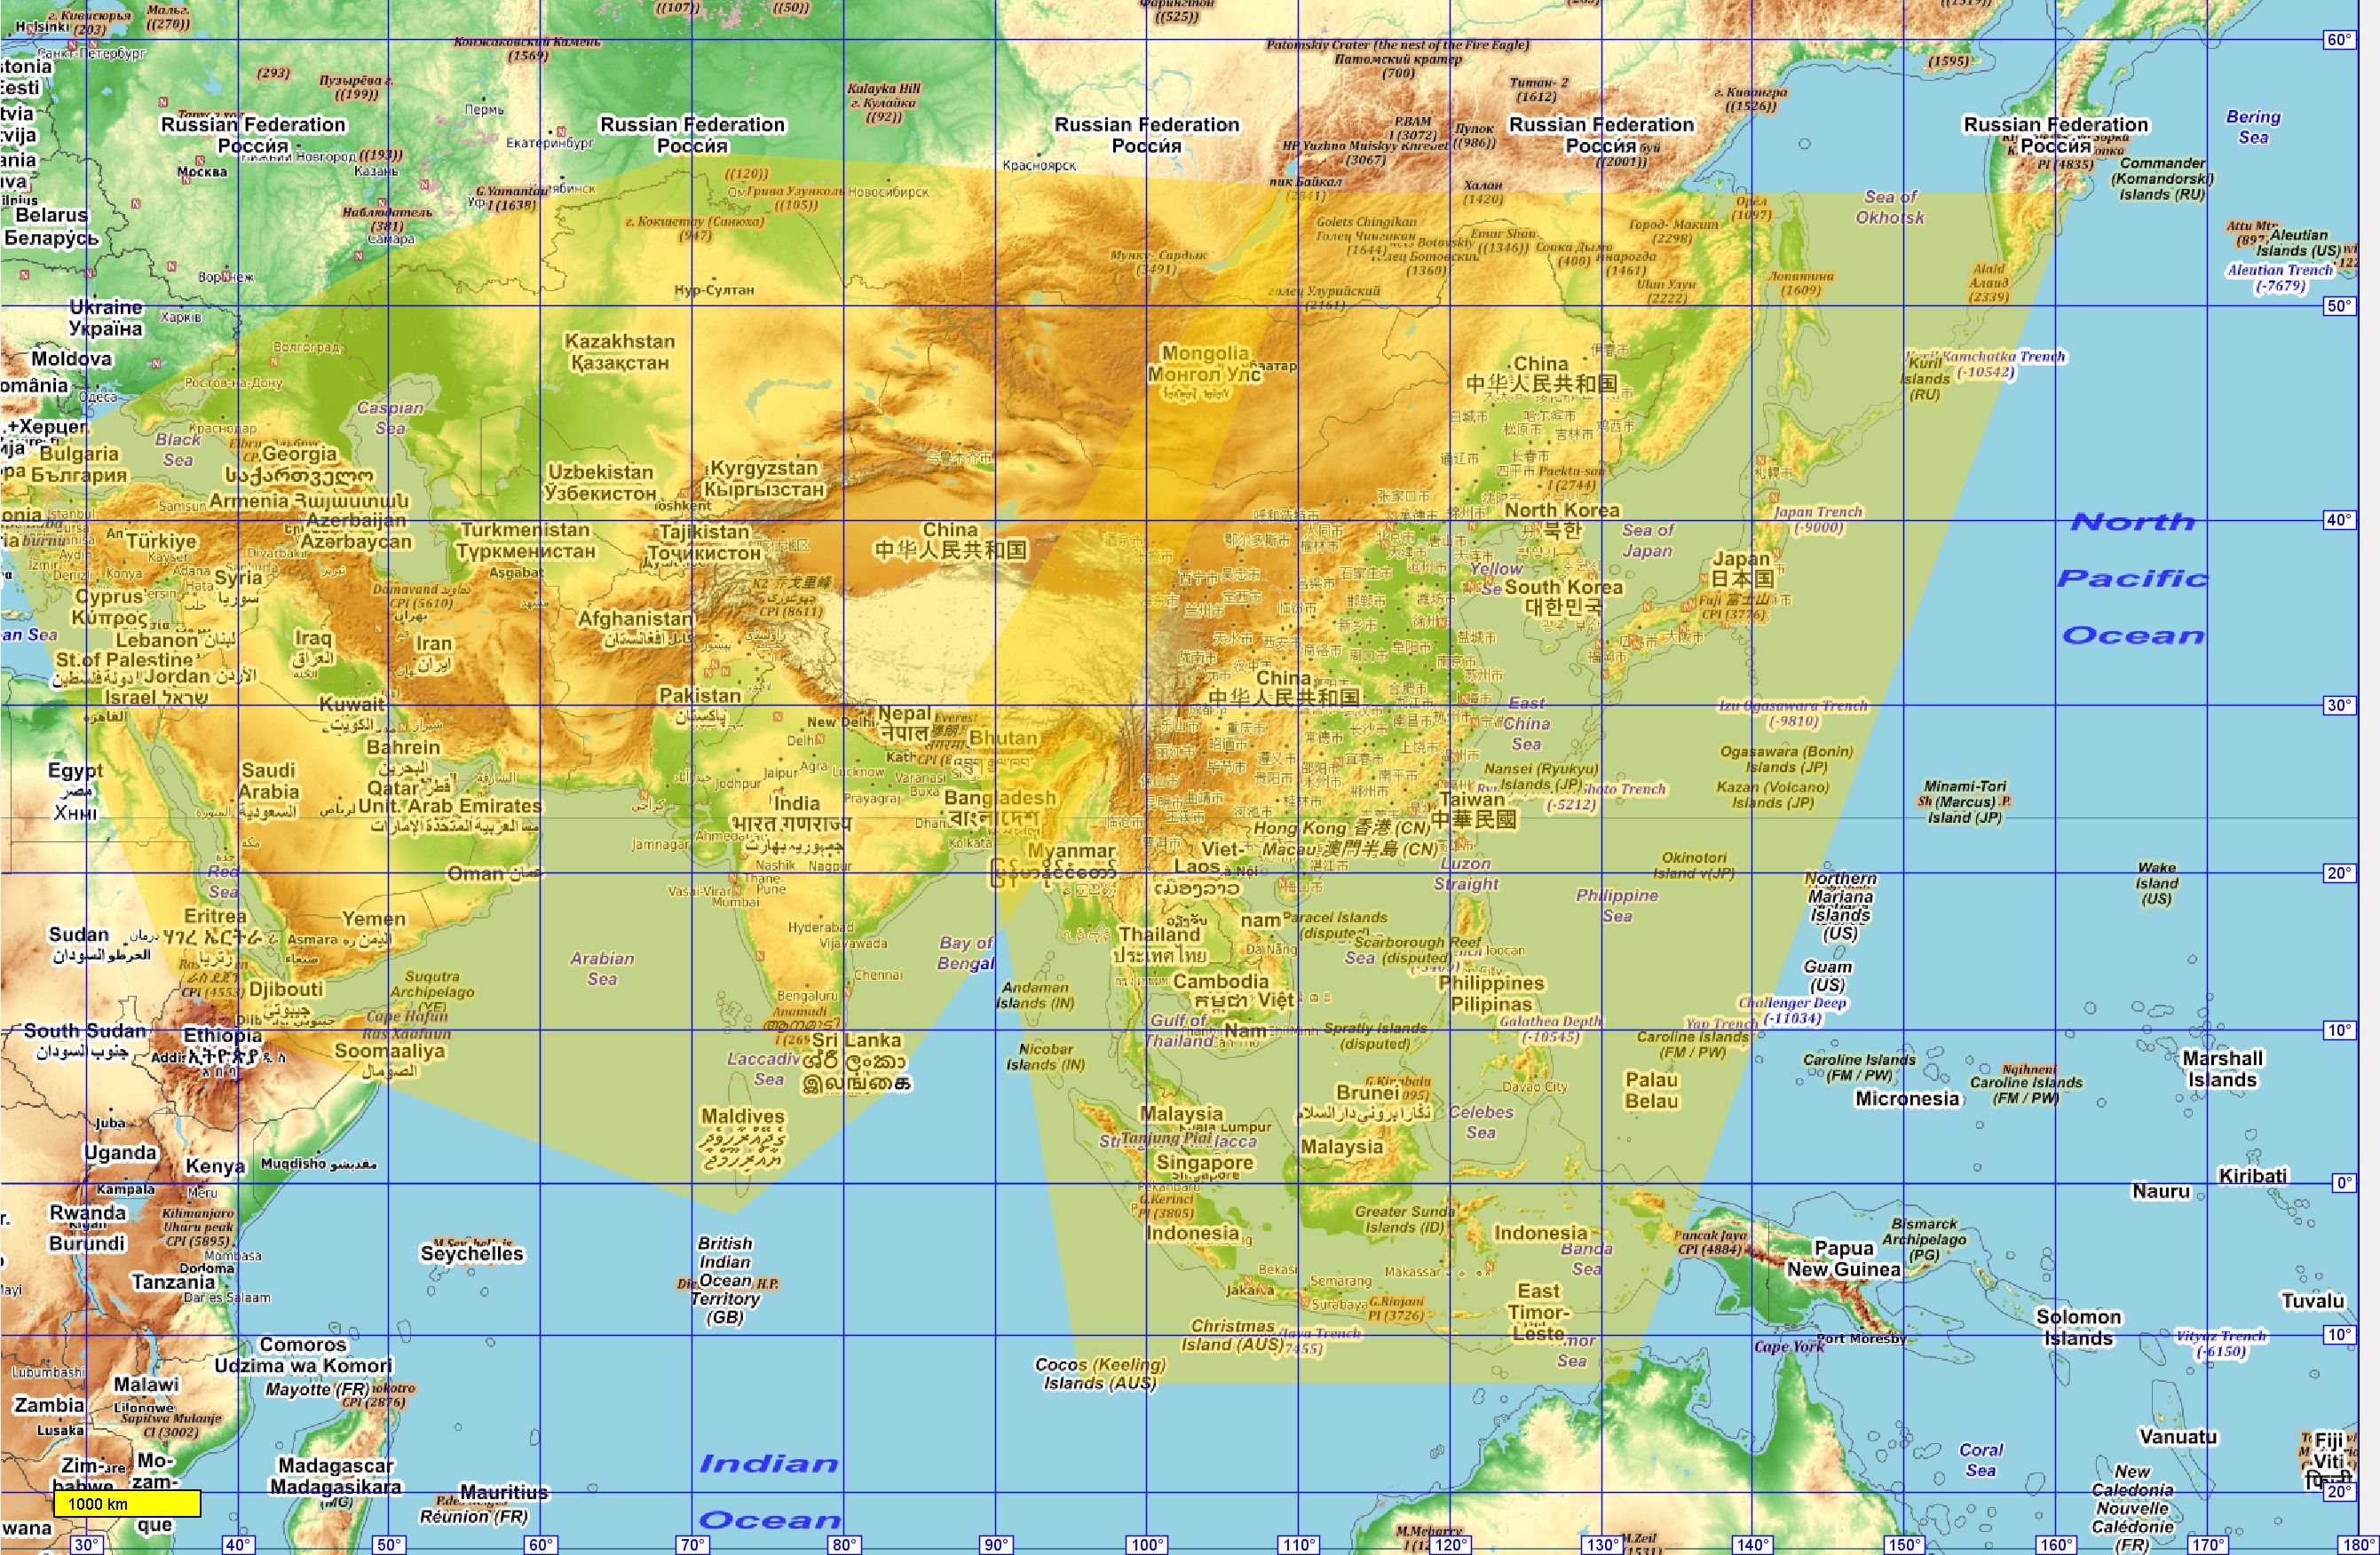
Ranges: ZL 8 84N/81.5S, ZL9 84N/78S, ZL 10 72-81N/78S; for ZL11-13 see https://www.openandromaps.org/wp-content/users/michael/Coverage-World-ZL-11-v202011.jpg and https://www.openandromaps.org/wp-content/users/michael/Coverage-EPMENA-ZL-11-v202011.jpg
Settlement selection for ZL8+: for each tile (fraction of a square degree, depending on ZL) only the few largest settlements are displayed, with the biggest one(s) visible on the top. This means that villages may be shown in regions like northern Canada or Siberia, while cities of 100,000 do not find space in metro areas. - All country capitals (red halo) are shown from ZL 5+, state/province capitals are highlighted in yellow (for US and CA incl. state's postal codes), region and depen-dent territories are shown with orange halo in italic (the latter include the country they belong to). For a number of states the list of province capitals may not be complete, as OSM lacks quality in this respect.
- Settlement, peak, island and ocean deep names are extracted and selected as described above from OSM data by using the OSMOSIS toolset and additional linux scripting. Those names are then rendered using Maperitive, and the result is overlayed to the backgound maps using MOBAC.
- Selected peaks of the Earth are shown with a brownish background; the greatest ocean deeps are shown in blue.
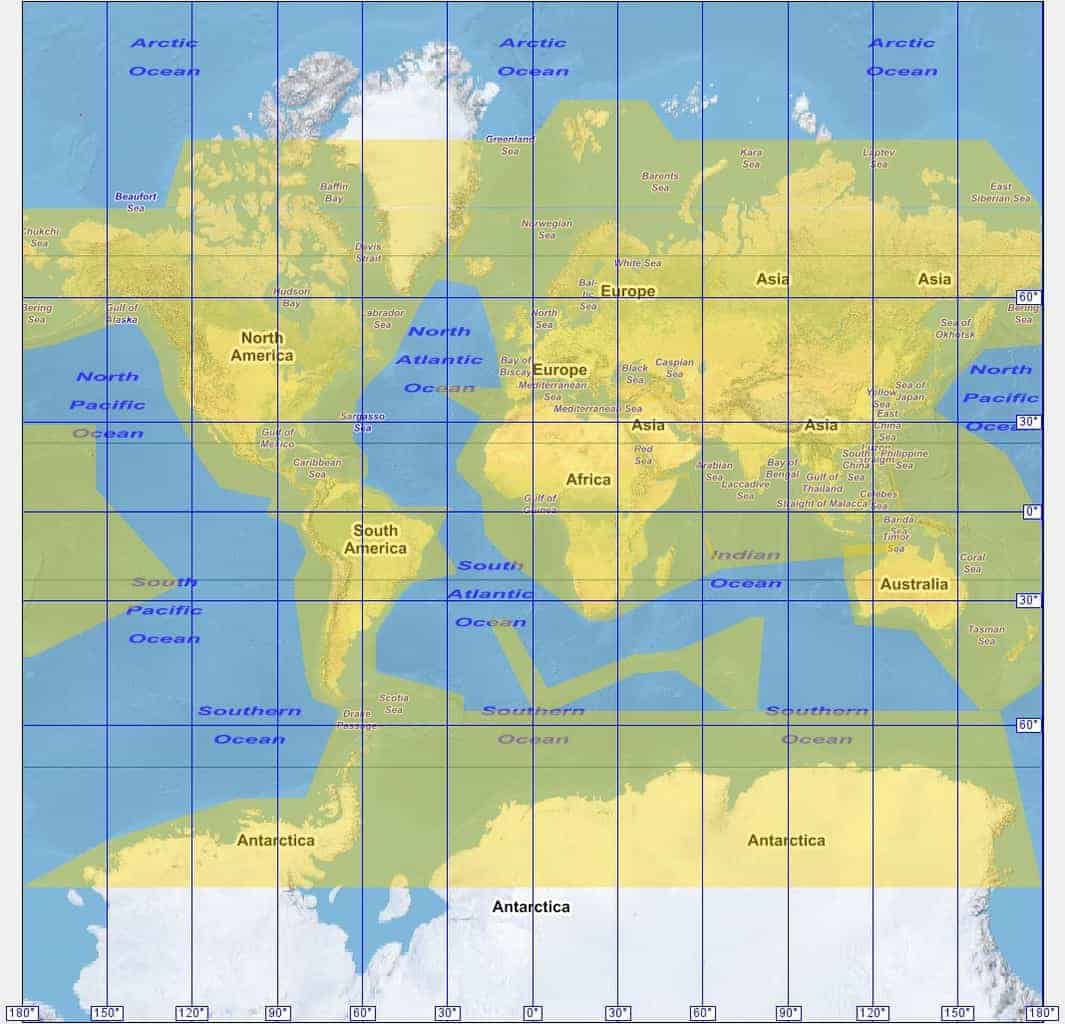
The following table indicates from which ZL peaks of certain dominance or category appear. Category I stands for peaks with a dominance of >= 1000km (from peakbagger.com). The 125 most prominent peaks (according to the list in Wikipedia) are marked with P and the highest points of countries and dependent areas are marked with C, or combinations thereof. These abbreviations or their combinations appear in front of the altitudes of the peaks. The lists of peaks by dominance are generated by a programme based on the work of Max Berger, which in turn uses the elevation data of Jonathan de Ferranti. This overview shows the Arctic and Antarctic regions as highlighted in yellow that are used in the following table :

Isolation (km) / Category 200+ 100-200 50-100 35-50 15-35 / C P I Arctic from ZL 4 6 7 8 9 4 5 4 from ZL in mid latitudes 6 7 8 9 10 6 5 4 Antarctica from ZL 3 4 5 6 7 3 3 3 - The abbreviations for energy sources and power plants are as follows:
Symbol Meaning Symbol Meaning Symbol Meaning B bio mass, bio gas C coal and unspecified fossil ressources G gas power plant geo geothermy power plant gw gas well H hydro power plant N nuclear power plant O oil power plant op offshore platform ow oil well P unspecified power plant pw unspecified ressource well S solar power plant or installation T waste disposal power plant W or WP wind park/farm (WP) or turbine (W)
List of sources and features
Author: Michael Bechtold (license: CC-BY-SA)
History of release notes
202307-1.0
- The OAM background from ZL 8 up now is rendered from the July 2023 edition of Christian's OAM vector maps.
- Increased and earlier visibility of offshore energy and power sources for ZL 4 to 8, while reducing visibility of the land based installations for those low zoom levels.
202307-1.1 (Sep. 2023
- The OAM background from ZL 8 up now is rendered from the September 2023 edition of Christian's OAM vector maps.
202307-1.2 (Nov. 2023
- The OAM background from ZL 8 up for Europe now is rendered from the November 2023 edition of Christian's OAM vector maps.
202303-1.0
- The OAM background from ZL 8 up now is rendered from the March 2023 (Europe: April)edition of Christian's OAM vector maps.
- The base theme is now Tobias' current Elevate version 5.2, with my adjustments. The most obvious changes versus the earlier OAM world maps are:
- road numbers have a more intense colour for better readability
- normal peaks (i.e. beyond the highlighted ones) have a better readability and the letters have a brownish colour to distinguish them from settlements
- volcanos have a dark red marker and letters for easier recognition versus normal peaks - In ZL 13 only 50m contours are shown, because with the finer lines the respective map parts were hardly readable. In adition it saves a total of 8 GB across all maps 🙂
202212-1.1
- Triggered by the request of a North American user I produced ZL 12/13 maps for much of North America (see coverage map: NA12-13).
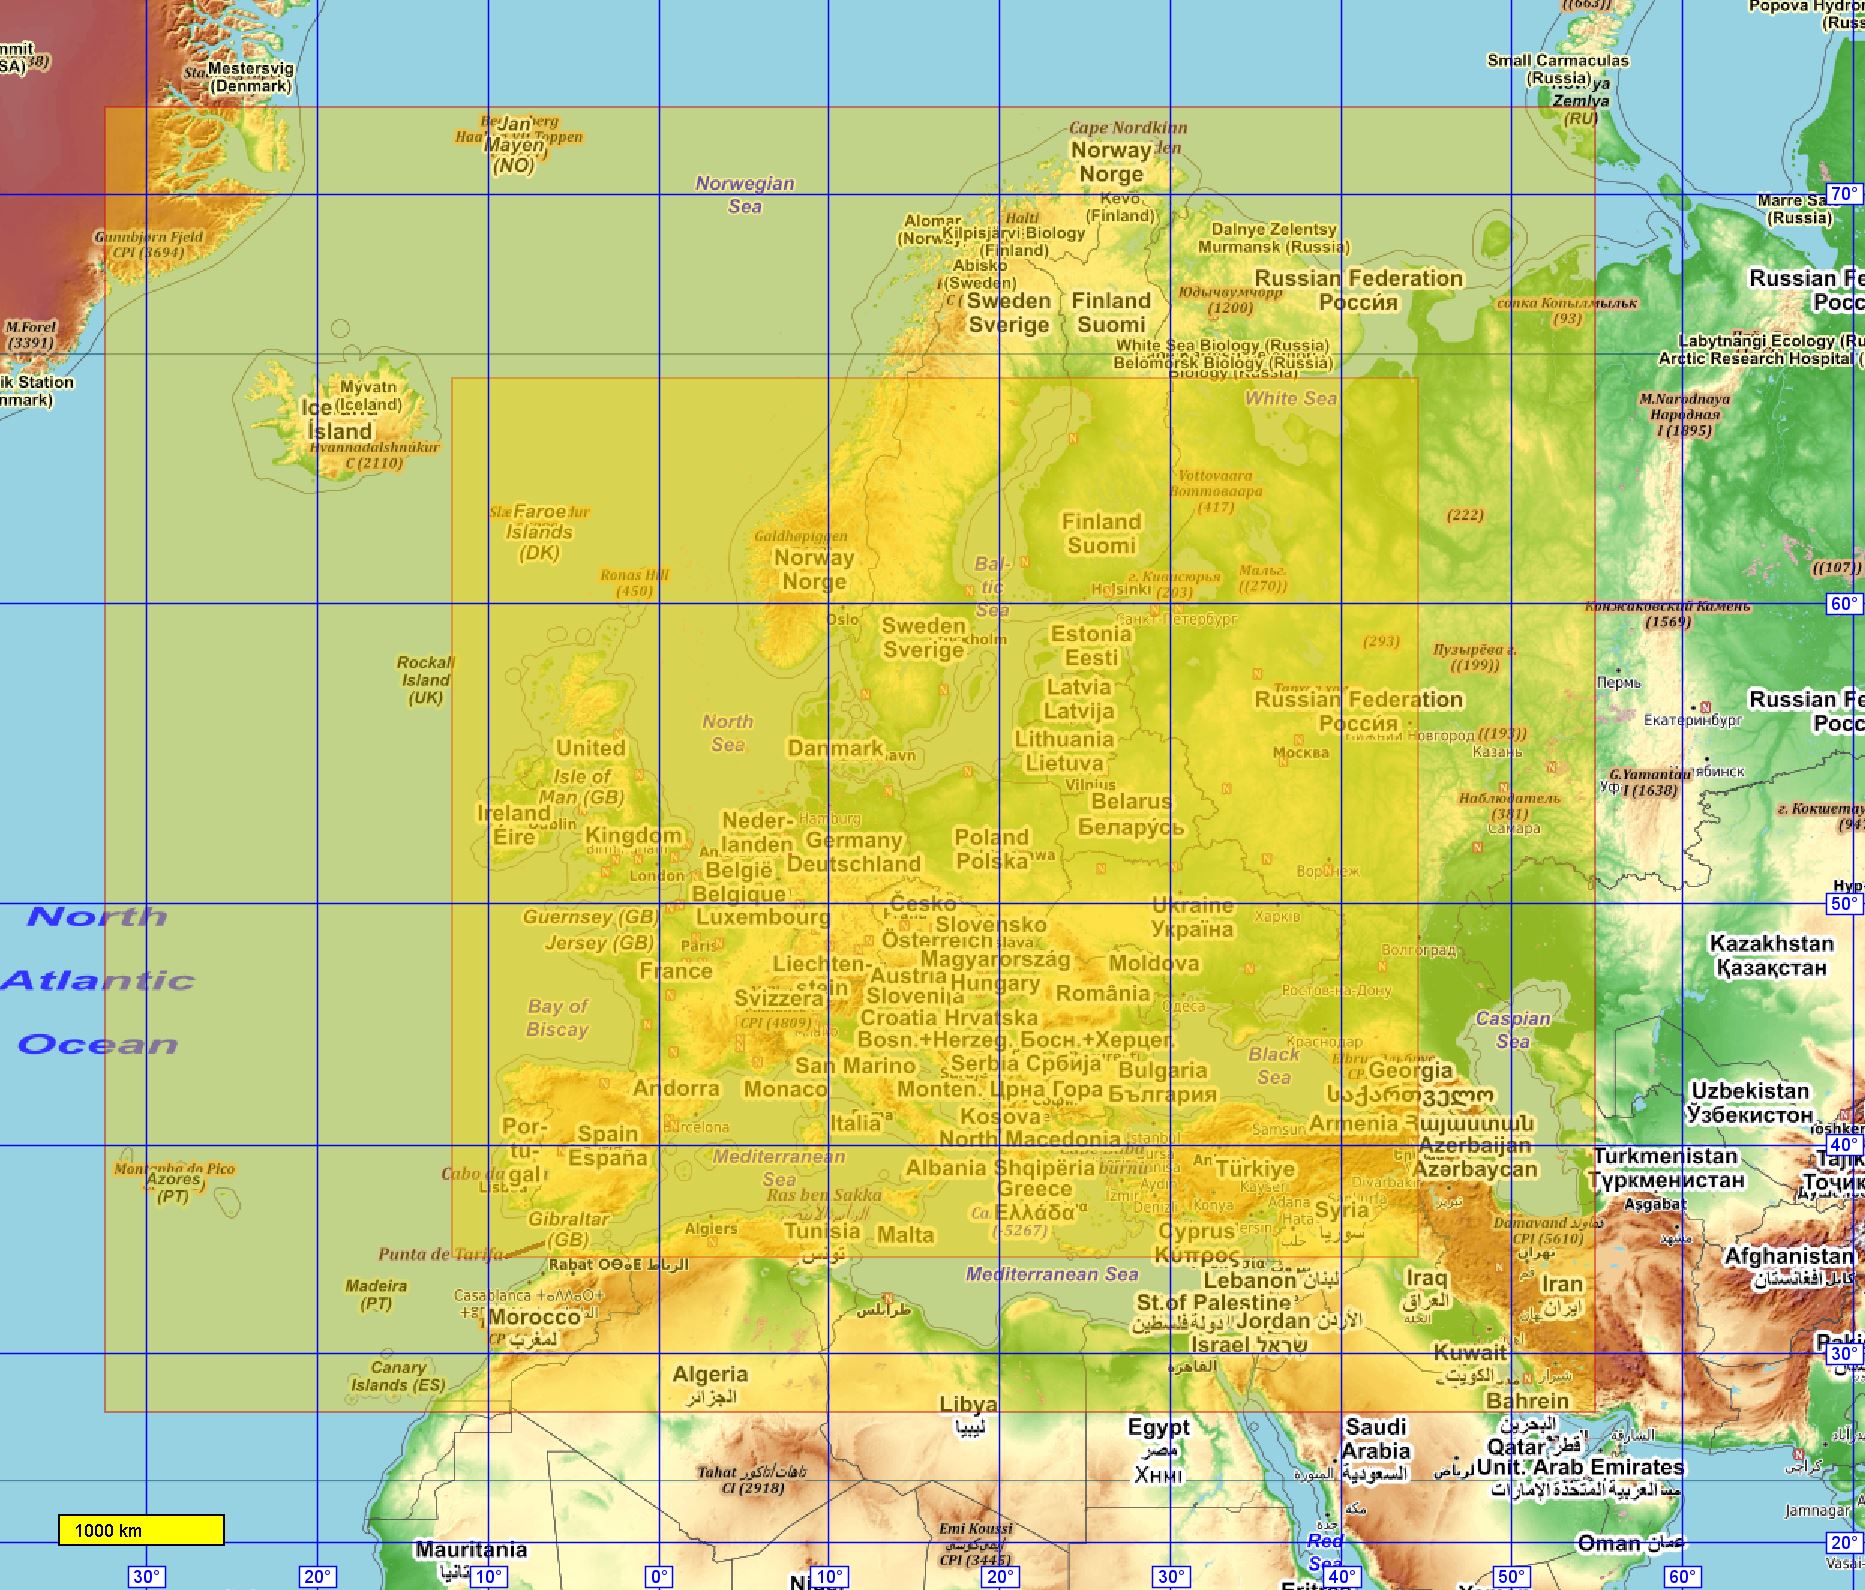
- While ZL 12 and 13 maps have been available for parts of Europe already, I have created an additional set of maps with ZL 12/13 with wider coverage (see coverage map: EP12-13).
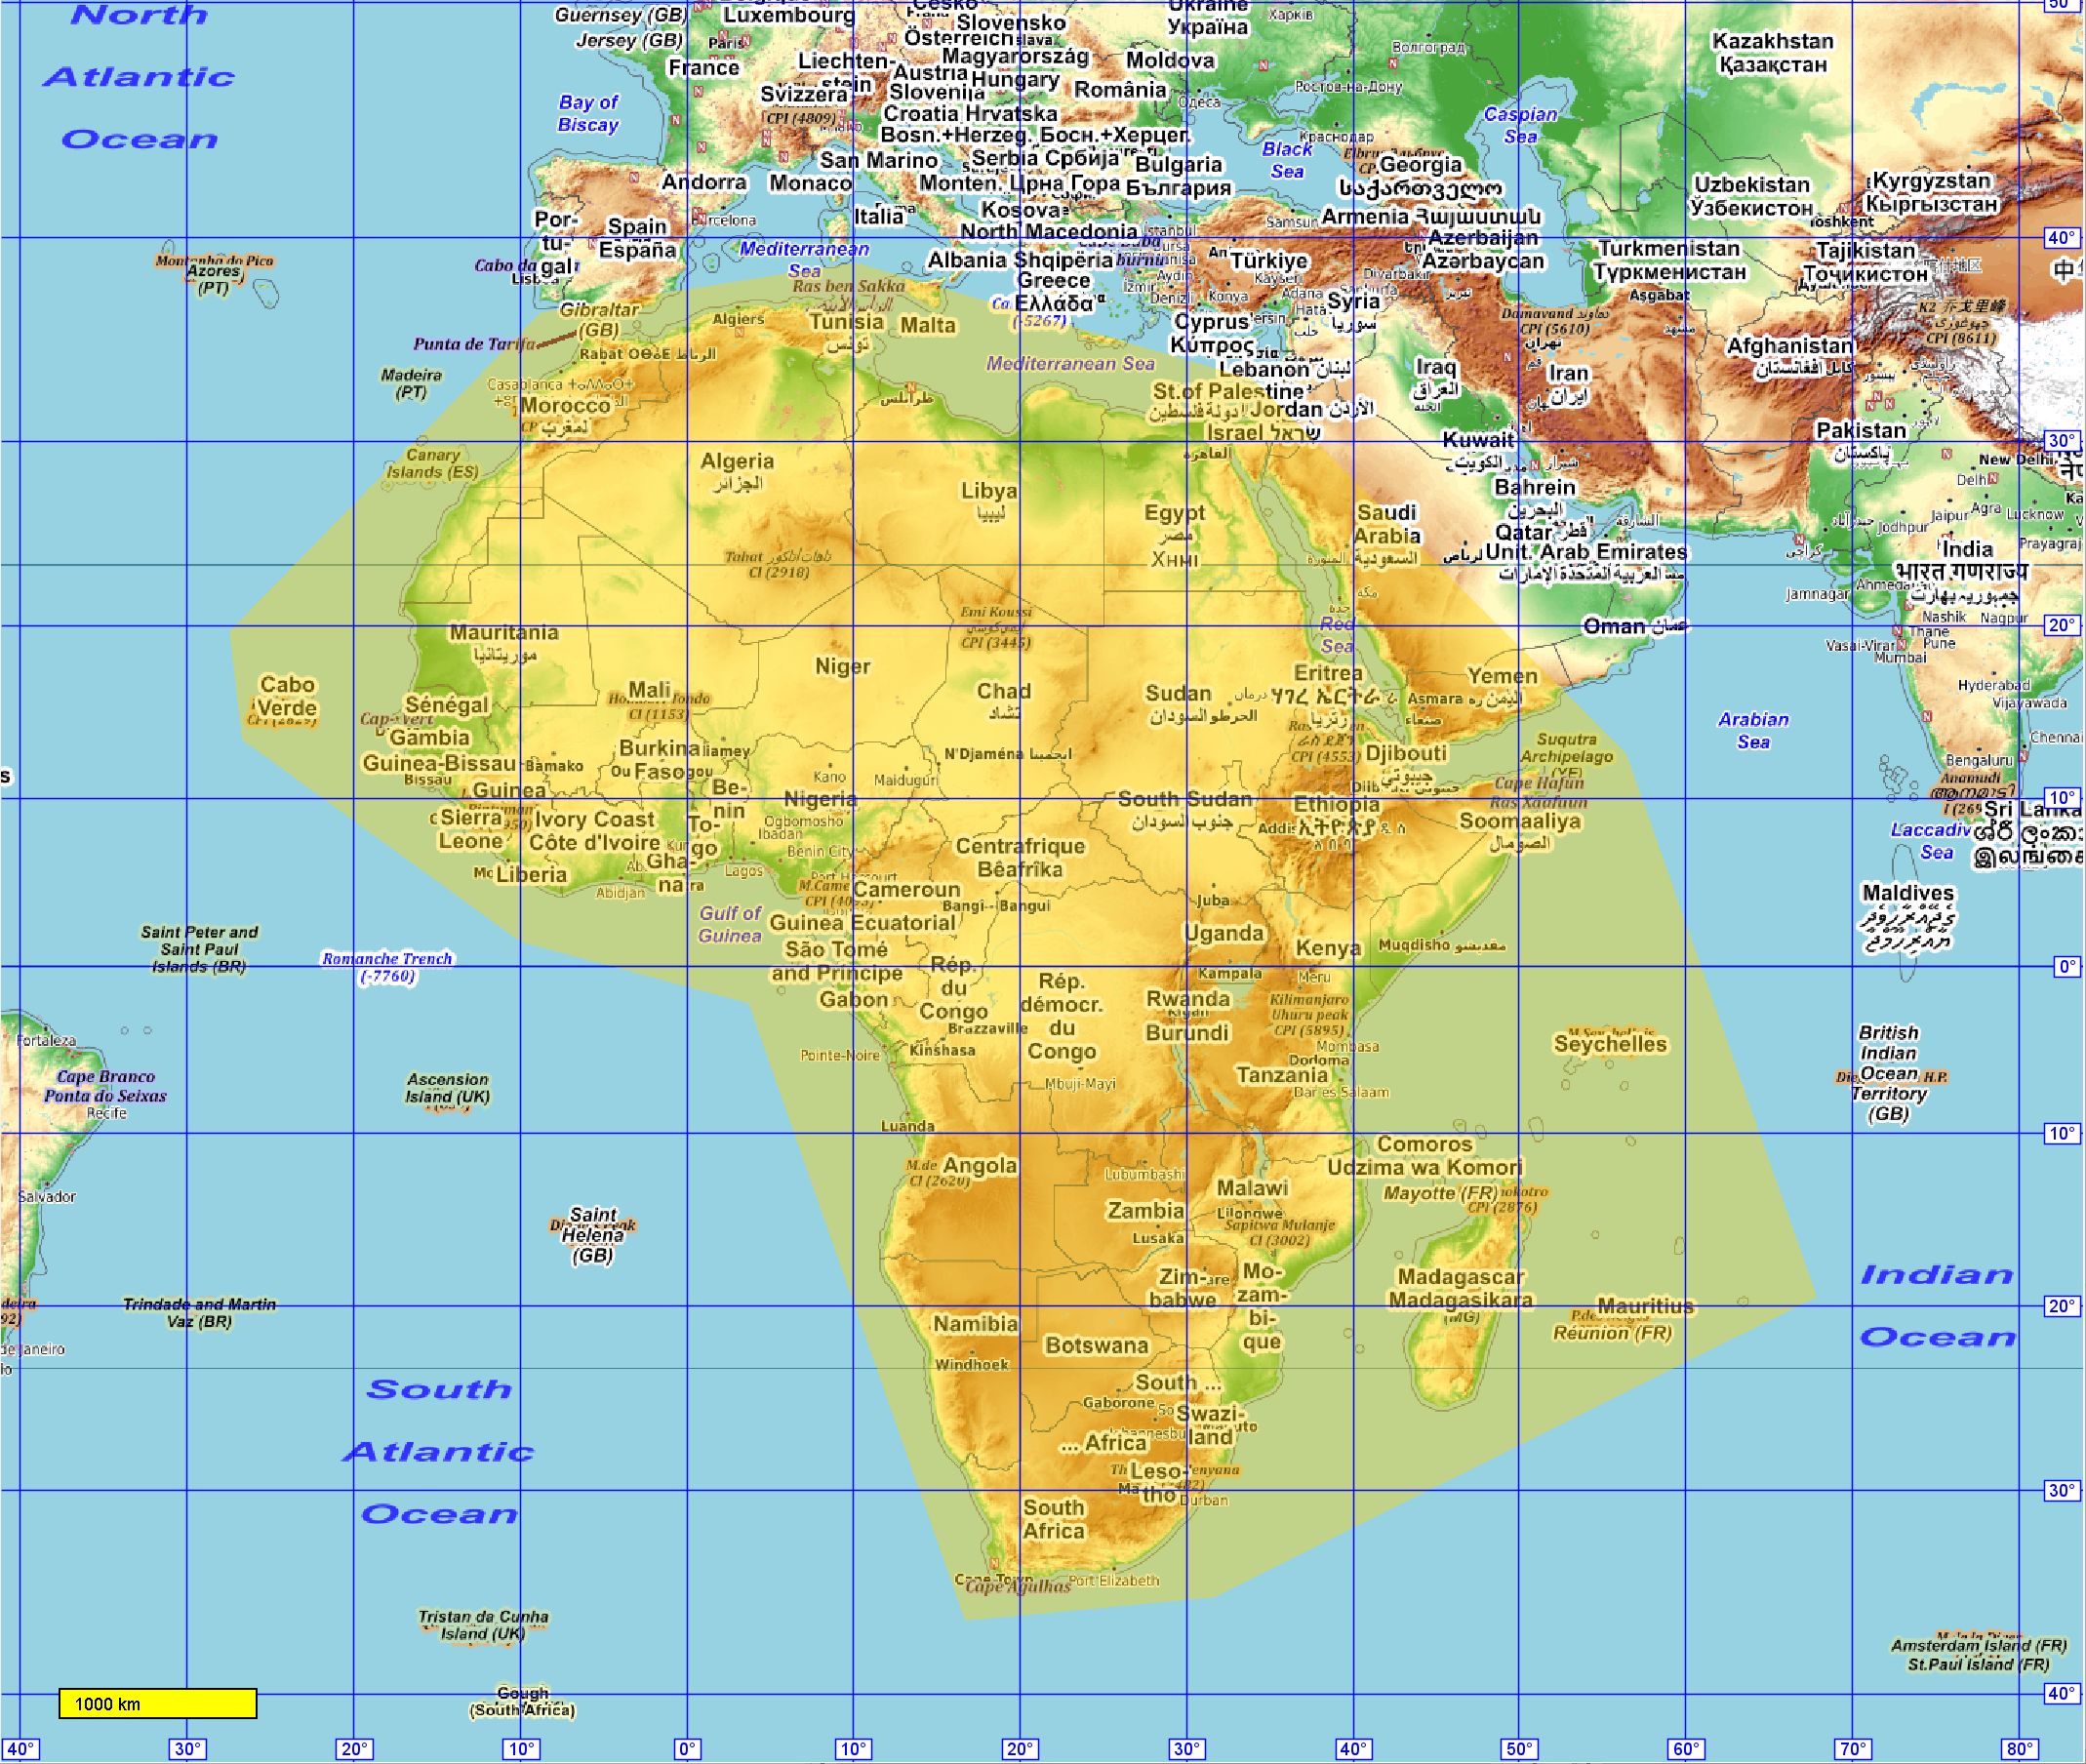
- Once this train started rolling, I also produced ZL 12 maps for much of Asia, split in two, as well as for Africa (see coverage maps: AS12 resp. AF12).
- The OAM background from ZL 8 up now is rendered from the Dec edition of Christian's OAM vector maps.
- The torrent downloads are now separated into three chunks: World maps, regional maps at ZL 11 and regional maps at ZL 12/13.
202211-1.0
- The OAM background from ZL 8 up now is rendered from the Oct edition of the OAM vector maps.
- Wind turbines could overcrowd and hide streets and other useful information in ZL 9 - 11. Now a grid based grouping into "WP" is used, substituting all turbines in the respective tile (~4km for ZL 9-10, ~2km for ZL 11). Offshore farms show all turbines as available in OSM.
202207-1.3
- The OAM background from ZL 8 up now is rendered from the July edition of the OAM vector maps.
- Locus download script for ZL 11 World map corrected.
- Added ZL 10 world map as J80 sqliteDB - on request.
202207-1.2
- Explanation of map categories and download options added before the download table.
202207-1.1
- Multiple identical labels for some solar and wind farms are combined to one for each. Corrected label multiple instances to one. Only 6 maps that contain Europe ZL 11 are affected.
202207-1.0
- OAM base maps updated to May 2022 for Europe and to April 2022 version for the rest of the world.
- After longer break the ferry connections for ZL 6 and 7 are updated as well as the energy productions (following respective lists from Wikipedia).
- The regional addon and overlay maps are unified: OAM-W1-7-EP8-12-J80.mbtiles (as an example) contains the world up to +/- 85 latitude and ZL 7 as well as a large chunk of Europe from ZL 8 to 12 consecutively. Hence those maps can be used independantly as well as an overlay. Also, now it's only 21 maps and 70 GBs (instead of 110 GB).
- Up to ZL 12 all maps consist of tiles in JPG 80% quality, a real progress compared to the former 60% of the addon maps and somewhat better than the 70% of the earlier world maps. File sizes increase reasonably, wich is over-compensated by the storage capacity increases of recent years. For ZL 13 a quality of 70% is used.
- The maps can be grouped as:
- world maps ZL 8 to 11; JPG 80%; MBTiles
- world maps ZL 10 and 11; PNG format; sqlitedb (for apps that cannot handle MBTiles)
- regional maps up to ZL 11 (all continents), 12 (large parts of Europe) and 13 (smaller segments of Europe); JPG 80% resp. 70%; MBTiles
The MBTiles world maps are available as direct downloads for Locus and Orux apps; all groups can be downloaded manually, too.
202202-1.0
- The OAM base maps are from Feb. 2022 for Europe and from Jan. 2022 for the rest of the planet.
- In the high North hill shading showed extreme distortions from earlier data sources. Current elevation data provides a much better representation. In the end, hill are the only relevant thing of notice in those regions ...
- Missing tiles around the date line (+/-180 degrees) are available now. Many TXs to Emux (Mapsforge) and Robert (MOBAC) for amending their toolsets.
- The old naming scheme for world maps is no longer offered.
202108-1.1
- Now based on Christian's OAM maps from Sept. 2021.
- Correction of OAM-World-1-11-J60.sqlitedb (ZL 1-10 were missing before).
202108-1.0
- The density of settlement names has been reduced considerably for areas with names in two alphabets (latin plus cyrillic, arabic, chinese), hindi, etc.) or higher settlement density (Paris, East Coast, Madrid). [for curious people]
- The names of places (not in the sense of settlements) now appear (*) in areas that are settlement-free, with a brownish border. With this edition, farms are also shown this way (hardly in Eastern China, Central Europe, etc., but in Australia and the US Midwest, e.g.).
- The regional addons to the ZL-10 world map with a transparent top zoom level for Locus are dropped. In Locus 4 there is the max. re-scale mechanism which makes this overhead unnecessary. In Locus 3 the top level is zoomed in for 2 zoom steps before the vector map becomes visible as well.
- At the suggestion of Sonny (specialist for DTM) the world maps get a prefix that makes the names less cryptic. For example, W1-10-J70.mbtiles becomes OAM-World-1-10-J70.mbtiles. However, for a few releases I will provide both naming schemes to give users more time to adjust the settings in their apps (with the discontinued model being marked as such).
- Correction of the nationality of Agaléga Islands (SC -> MU).
![[for curious people]](https://www.openandromaps.org/wp-content/users/michael/OSM-ZL4-low.jpg)
(*) well, since April in fact, but undocumented 🙂
2021-01/04, Version 1.2
- In Antarctica and the far north, the maps are quite empty; now isolated and prominent mountains there can already be seen in lower ZLs. The regions concerned are highlighted in yellow here: Areas with peaks appearing earlier
- The curated summit lists are also treated in an improved way: in front of the altitudes, the categories to which the summit belongs are now indicated; C for the highest points of a country or dependent area, P for one of the 125 most prominent summits on the planet and I for summits that have more than 1000km of isolation, or combinations thereof.
- In addition, dominances of 200+km are now used for the earliest ZLs with peaks.
2020-11/12, Version 1.1
- For energy sources as well there a "mapping diversity" (i.e. chaos) which I worked through to a large extent (as special cases in the script). From ZL 4 on those are displayed: first as small redish dots, growing with the ZL, finally at ZL 9 fully readable; always half opaque. For the amended list of abbreviations see above.
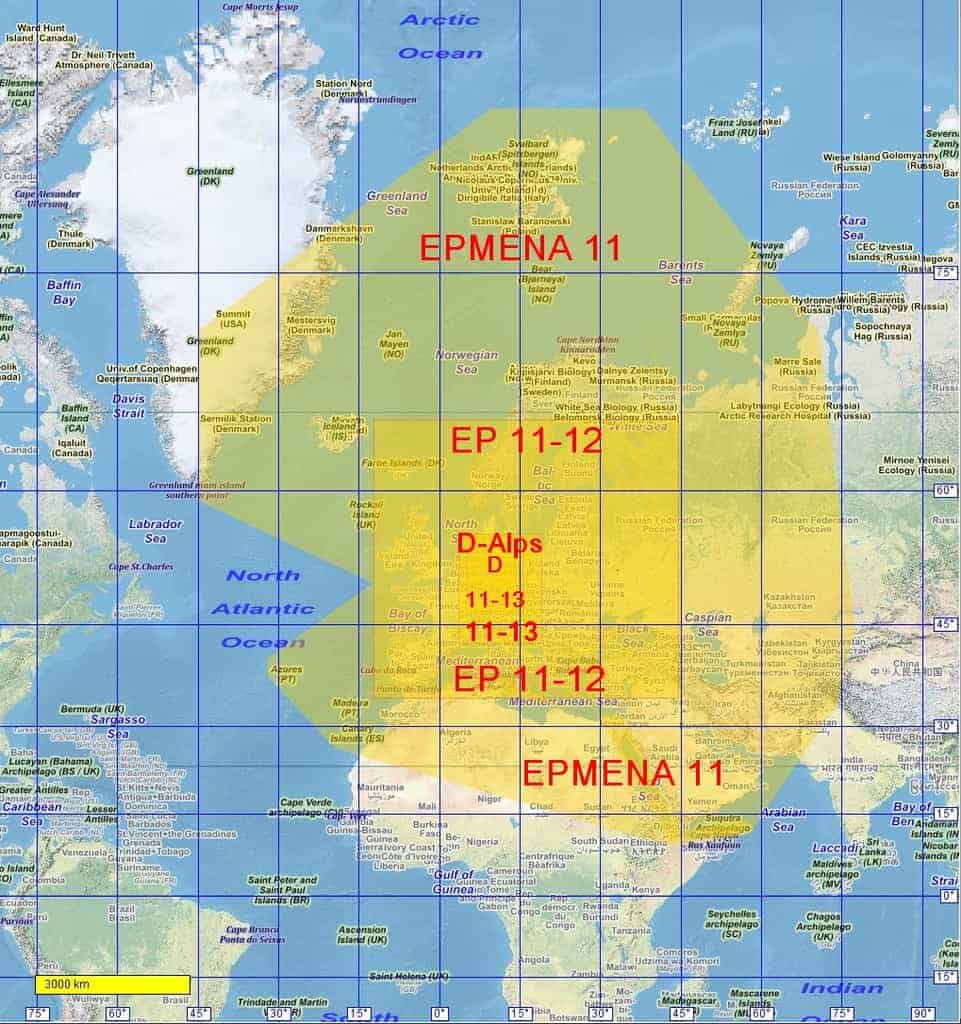
- Natural resources are being explorer in more and more extreme latitudes, hence the scope of ZL 11 maps has been extended to the north, up to 72°. EPMENA-11 now even contains Spitzbergen, as well as the south-eastern part of Greenland. NA-11 contains the south-western part of it.
- As usual additional provincal capitals have been added and some errors corrected.
2020-08/09
- When generating the new coverage images I noticed a line between the Balkans and Patagonia - the consequence of a script error since 2018, that only got apparent with the OSM data from July. While cleaning up I also included oil wells into the maps (from ZL 10 on, as for Solar etc.).
- Some maps are offered in SQLiteDB format, in addition to MBTiles, for apps that cannot work with MBTiles.
- The melting in the Ant-/Arctic makes the research there ever more important. Their list is updated according to current Wikipedia information, now with the Arctic stations, too.
- In doing so, I extended the map coverage for ZL 7 to 10 - see here. The collapse of memory card prices more than compensates for the increase in map sizes 🙂
- Settlements, Ferries and Power Plants are based on the 5th of July 2020 OSM database information (unfortunately only with this release 1.1).
- From this data base, hundreds of province capitals have also been added.
- For the first time a world map in PNG format is offered; i.e. all information of all zoom levels is rendered in loss free PNG format. That quality comes at a price: nearly 6 GB for ZL 1 to 10. That makes sense (only) for exports or screenshots from high res. devices.
- All other world maps up to ZL 10 are compressed to JPEG quality 70 for their highest zoom levels. The regional maps with ZL 11+ are coded with JPEG quality 60.
2019-10-24 / 2019-11-05
- Correction: Vladivostok/Khabarovsk status
- For capitals the font size is increased again somewhat for ZL 9 up.
- There is a better quality source for Gall-Peters-Peters-projection for ZL 1: www.giss.nasa.gov/tools/gprojector/help/projections/GallIsographic.png; I only needed to amend better visible degrees for the grid.
- ZL 11 maps for Europe-MENA are extended towards East up to northern Urals, then towards Astana and comprise Iran fully; the ZL11-12 maps for Europe now cover the Black Sea fully and include Nizhny Novgorod further north.
- The selection of settlements ideally would work like a "window" of a (ZL dependent) specified size, sliding across the map and marking the requested number of largest places in the window for rendering in the map. In the past those "windows" were just adjacent; now windows are evaluated in addition that are shifted by half of their dimensions.
- The major five circles of latitude are shown in ZL 2 to 4.
2019-04-18 / 2019-06-08
- Correction: incomplete capital name labels, adapt map/zoom overview to map content
- Font sizes for countries and capitals have been reduced for ZLs 4 to 10.
- The maps with transparent highest ZL are delivered as MBTiles now, too.
- All maps got a map center. For W1-8..10 this is set to extreme Antartica, not to interfere with "nearest map" features of Apps. For regional maps it is set to the center fo the map scope.
- Now all maps use the Peters/Gall projection (which has fidelity of area - just compare Greenland and Africa in the usual maps ...) for ZL 1, taken from TopPlusWebOpen (http://www.geodatenzentrum.de/geodaten, license www.govdata.de/dl-de/by-2-0).
2019-03-20/23
- Now the new release of all OAM maps is the background for the world maps (from ZL 8 up). And Natural Earth is used as the background for ZL 1 to 3.
- Also a number of formattings and positions of names have been improved.
- W1-8min-MBt and the overlay maps now use the Peters projection for ZL 1, taken from TopPlusWebOpen (http://www.geodatenzentrum.de/geodaten, license www.govdata.de/dl-de/by-2-0).
2018-12-04/16
- A new category of maps is being introduced: MBTiles maps that show the world up to ZL 8 and then continents resp. regions from ZL 9 onwards.
- The Pacific maps now comprise Polynesia (east of date line) as well.
- For China the districts are shown, as parts of the provinces.
2018-11-20
- Improvement of name formatting.
- Update and amendment of capitals.
- At the head of the source and feature list the scope of the overview maps is shown on 3 world maps. Hint for interested parties: on the map ZL 1-9 shows the scale 3000 km nicely shows the distortion at higher latitudes.
2018-11-11
- Update of settlement names; about 2000/7000/24000 places added in zoom levels 8/9/10.
- Only for (OSM-) geeks: this increase is mainly attributed to the inclusion of OSM "ways" and "relations" for the settlement selection. Because, unfortunately, settlements ("place=...") are added as ways/relations into OSM, without mapping them as "nodes" first and then reference them in the resp. way/relation.
2018-09-23
- Presentation of power plants refined (W = wind, S = solar, H = hydro, N = nuclear, O = oil, C = coal, P = others).
- Add-On maps w/o transparent layer are now delivered as MBtiles, hence are usable by Orux.
2018-09-12
- (Wind) power plants added, visible from ZL 6 (quite well on sea).
2018-08-30
- Major capes added, currently up to ZL 9; more to be added over time.
2018-08-29
- Addon overlay maps with ZL 11 for the continents and ZL 12 for Central Europe (and neighborhoods), with and without additional transparent topmost layer
2018-08-27
- Ocean background fixed for ZL 9 around Revillagigedo Islands and Saint Helena.
- Ocean background fixed for ZL 10 around Easter Island.
2018-07-27
- Province capitals for more countries have been added, amended, corrected.
- For countries with many small provinces the first appearance of their province capitals has been raised to zoom level 8 or 9 (see the Balkans, Levante and SE Asia).